How To Analyze Power Data!
How To Analyze Power Data
By Hunter Allen
Start by opening your TrainingPeaks WKO+ program on your desktop/laptop computer (not the online version). Then, the first thing to do is to open your Calendar so you can see all your workouts and races. Double click on the one you want to analyze. Now, go to the bottom of the screen and make sure the Journal tab is selected. In the Journal you will see a Power Distribution chart. Double click on it to zoom it so you can see the details.
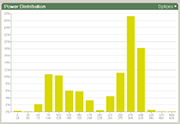
If it is a race, check out how much time you spent not pedaling. That's interesting because it's important to know if you pedaled too much in the race. The name of the game is saving energy! The downloaded power distribution charts of road race winners usually have a typical distribution chart that looks like this (click to enlarge the chart):
 Notice how the chart shows lots of time spent under 60% of this rider's Lactate Threshold watts (saving energy and resting) and then lots of time at Lactate Threshold. For this rider, that means lots of time under 175 watts and then lots over 275 watts. To translate, the numbers mean that the race winners usually pedal the least, but when they pedal, they pedal the hardest!
Now if it is was a normal training ride, time spent not pedaling is not as important. However what is important is how much time you spent in your power zones. And also begin to look for the time drop-off around your LT. Notice in the graph above that there is a huge drop-off in this rider's time spent from 275-300 watts, to the next bar (300-325 watts). This is a good estimate, ballpark guess, of this rider's Lactate Threshold. This riders LT is probably somewhere on the upper end of the 275-300 bar, but doubtful it is over 300 watts.
How can we tell this? Well, an athlete can spend plenty of time at or just below LT, but limited time above it. So, it's easy to make a case for a winning racer to spend loads of time just at their LT, but not much above it, as they know how to pace themselves well. Start to look for this trend in your power meter downloads.
The next thing to start looking toward is your Heart Rate Distribution Chart. This can show you how much time you spent in your heart-rate zones. Not as interesting, but it gives you a look into how much work your heart did.
By examining the Cadence Pie Chart, you can start to see how much time you spend in different cadence ranges. This can be informative if you are actively trying to increase or decrease your cadence for a specific workout or for overall physiological change.
From there, go to the Mean Maximal Power Curve Chart and hover your mouse over the line to see how many watts you put out at significant times. Remember though, if you did a workout with 5-minute efforts, and then look at the watts you produced at 6 minutes, it will not be a valid comparison to a previous ride, when you did specific 6 minute efforts. You must compare same time periods together from workout to workout. Also be aware that if you didn't do any sprints, then your peak power will not be representative of your true peak when you do sprints.
Now, let's move onto your graph by clicking the Graph tab on the bottom of the screen. First, decide how you like to view your data. Personally, I recommend the stacked view (rows stacked on top of each other) with no smoothing to start. If it is a road ride, then I prefer to view the watts, heart rate and speed. If it is a trainer ride, I prefer watts, heart rate and cadence.
 Begin scanning through your ride and remembering areas of interest. Create a range around the specific area of interest so you can further gain insight into the numbers. Let's say you went over a 20-minute climb. This should be easy to view, as your heart rate will be high, your speed low and your power fairly constant. It might look something like this chart (click to enlarge).
Notice how when the climb begins, the power (yellow) becomes smoother, the speed (blue) is lower, and the heart rate (red) goes right to the roof!
Once you have created areas of interest you can then compare these to previous efforts, to efforts of others, or to look deeper into that specific area to maybe examine your cadence.
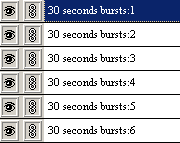
 Another way to help you in creating areas of interest is by using the "Fast Find" feature in TrainingPeaks WKO+. Let's say you did a bunch of 3-minute efforts, then 30-second efforts, and a 10 minute effort, and then a bunch of 1-minute fast-pedaling efforts. You can easily find these efforts automatically, by defining them based on the length of the interval and the watts that were held during that time. Once found, you can name them and even "link" them together, by clicking on the link box beside the eye box (on the left). Then you don't have to type them over and over, and this will also give you your rest time between each effort in your Summary on the Journal page.
After defining your areas of interest, you can now examine them further by reviewing the range box and the data contained for each area or by going to the Summary in the Journal page and reviewing there. Also at this point, you might want to update your Notes section in the Journal page. Remember that this section and the Workout Goal are searchable under the Calendar page. So, type in here things that you might want to search for in the future. From the above graph, I would type: 3 x 3 minutes, 6 x 30-second bursts, 10-minute effort, one minute fast pedaling and 20 minutes at LT. This way, this workout will be included in a Search of all 3-minute efforts you've done for the year.
A few other things to look for:
In race files:
* Use the Fast Find feature to pull out all of the times that you "burned a match." If your LT is 300 watts, then find how many times you went over 350 watts for 60 seconds or more and when those were. It's likely that, that was a "match" you burned and analyzing weather it was the right time to burn it or not can help you race smarter.
* Use Fast Find to count the number of laps in a race that you did and define them.
* Look at your TSS score and IF for a ride and see how they fit into your entire season so far.
* Look for your Peaks and determine where they are in the file. This will help you to further gain insight into the hardest parts of your race.
* If you got dropped, find the time before it and begin to walk backwards to see what efforts at how many watts you had to do, and where your breaking point was. This is particularly useful to examine what exactly it takes for you to get dropped in a race. You can then use this information to tailor your training plan.
In Training Rides:
* How many kilojoules of energy did you use during your ride and did you refuel enough?
* What was your normalized power for the ride?
This should get you started looking at your power data in a more productive manner and also allow you to get the greatest use out of the TrainingPeaks WKO+ program.
Hunter Allen is a certified USA Cycling Level 1 Cycling Coach and a former professional cyclist. With over 17 years of racing experience and 10 years of coaching experience, Hunter is widely known as one of the top experts in the world in coaching athletes using power meters, and offers training plans for athletes of all levels at www.TrainingPeaks.com.
